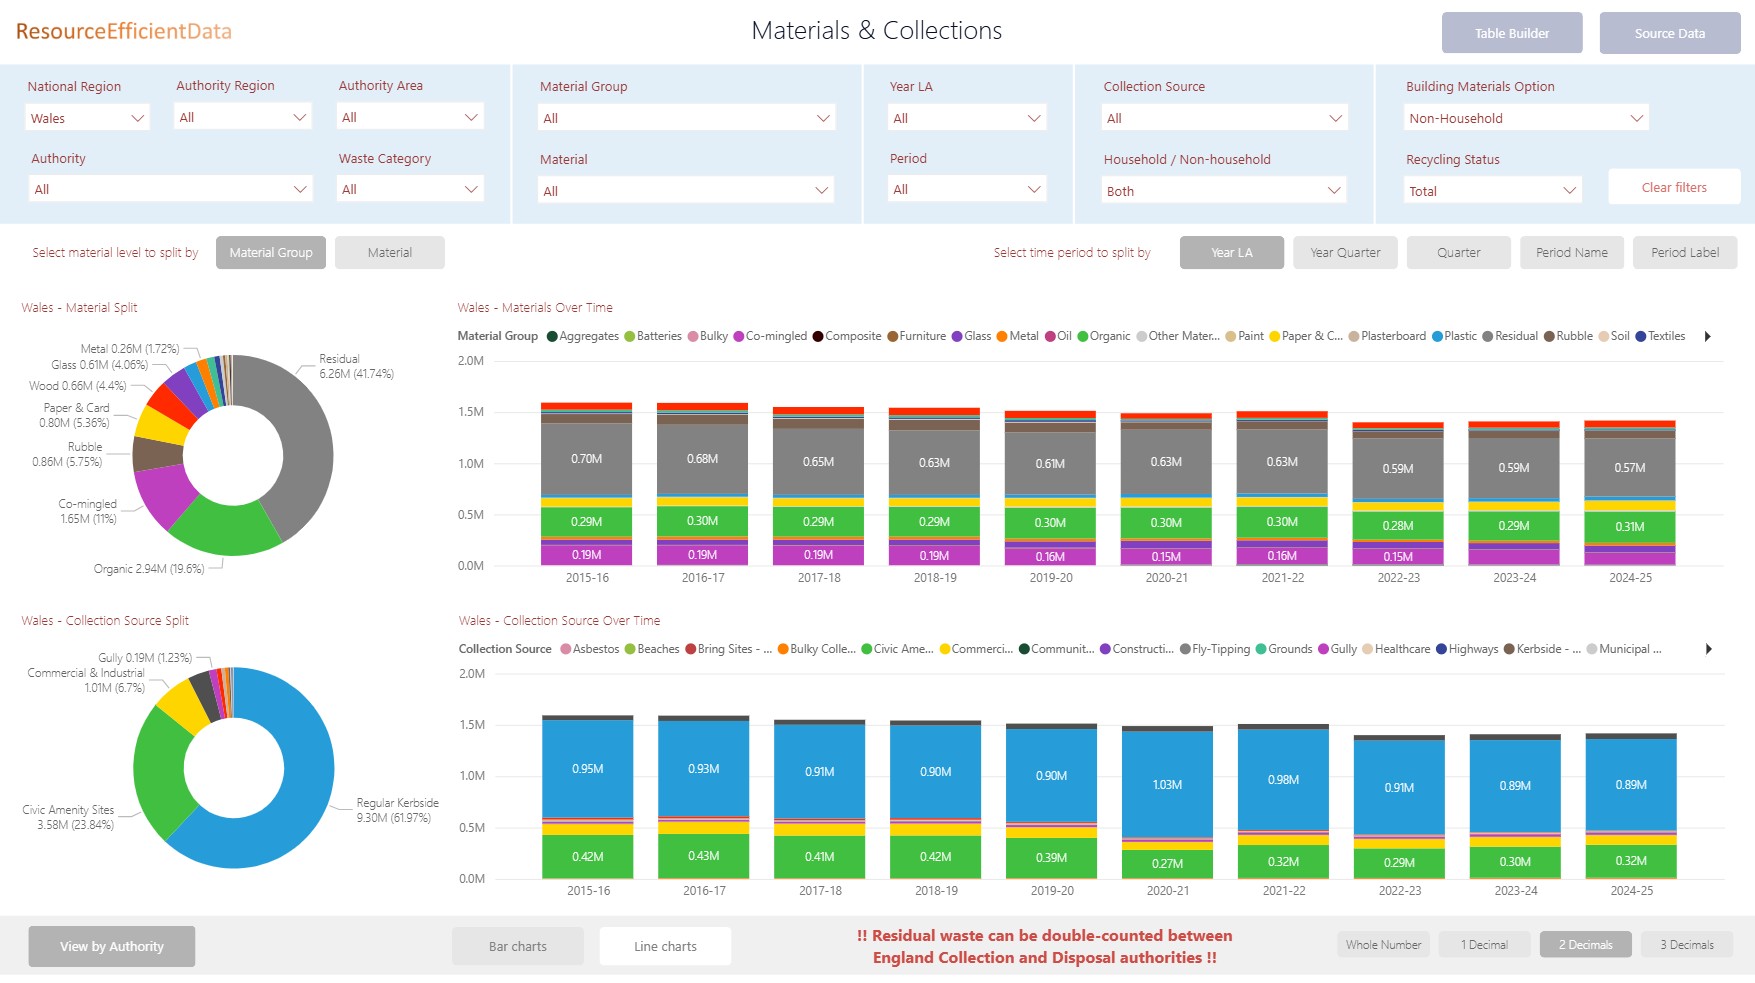
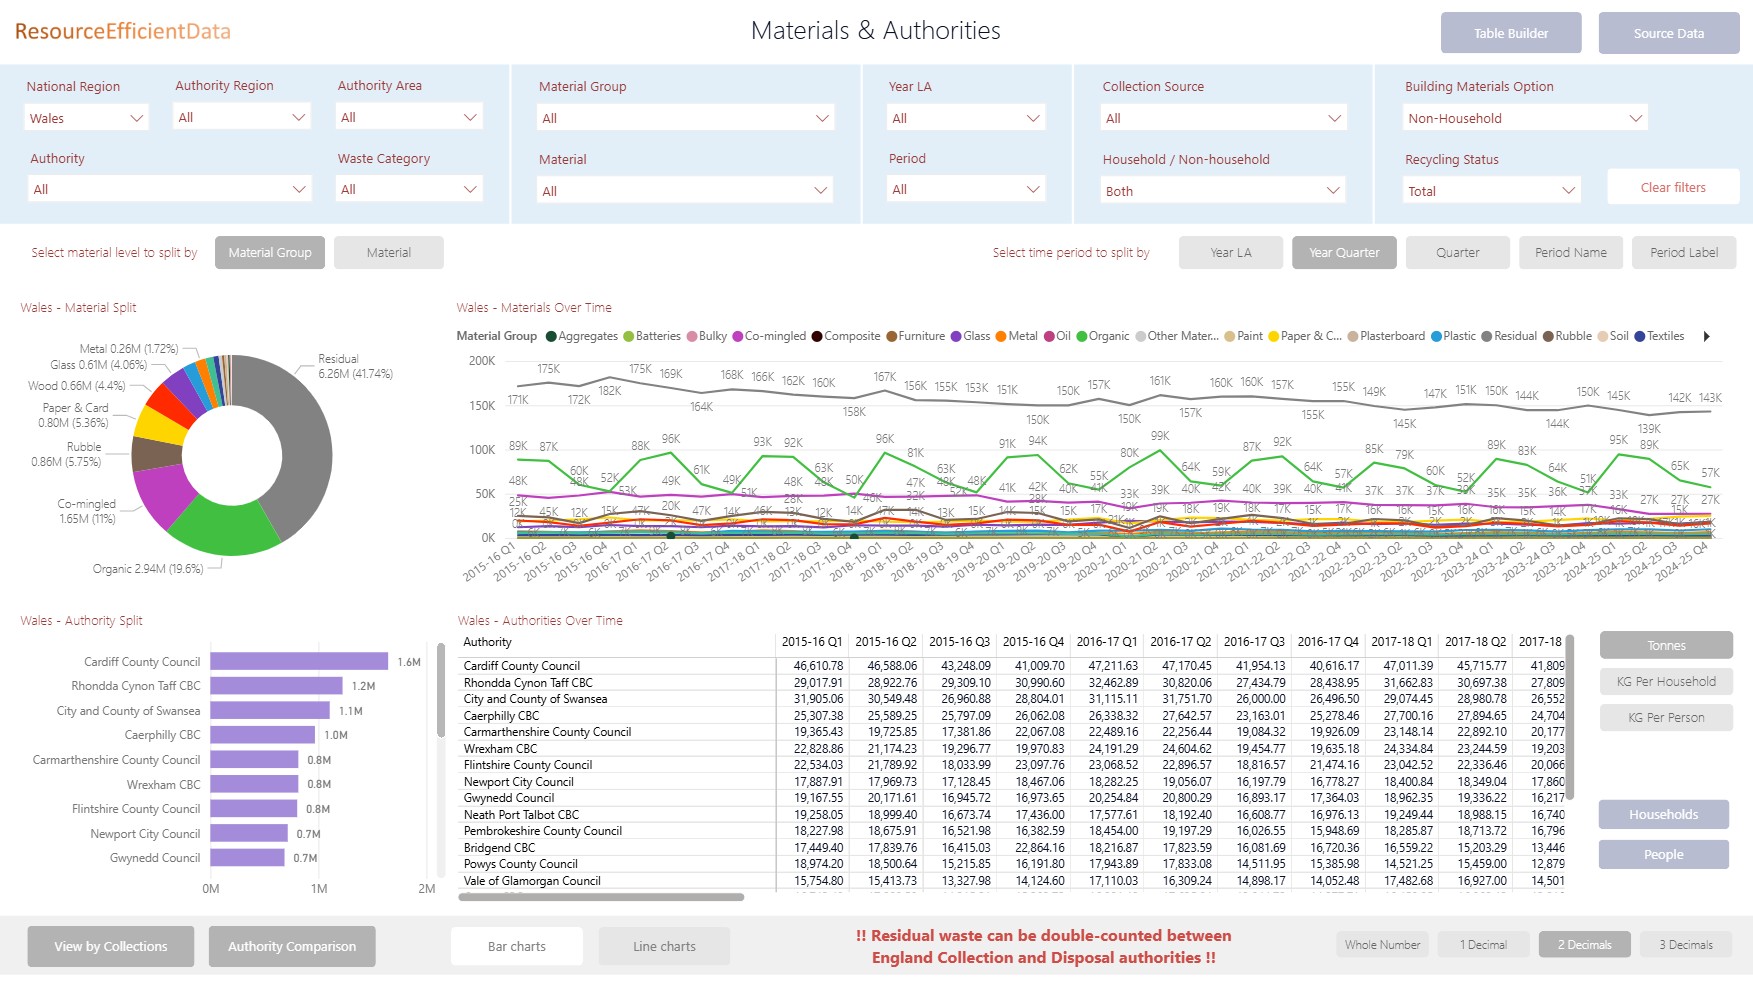
Waste Collections Report
Quarterly and annual summaries of the waste collections tonnages (non-Q100) from Waste Data Flow
- England, Scotland, Northern Ireland and Wales
- Ten years of data split by local authority, material and collection source
- Additional, indicative calculations for KG/HH and KG/P (based on household projections from relevant national statistics sources)
- Includes a page showing a summary of the raw data from Waste Data Flow driving the visuals
Waste Destinations Report
Quarterly summary of the waste destinations tonnages (Q100) from Waste Data Flow
- England and Wales
- The tonnages from Q100 where a material is specified and the facility type is 'Final Destination' (also 'Final Destination (Compliant)' for Welsh data)
- Currently ten years of data split by local authority, material, waste stream type and output process type
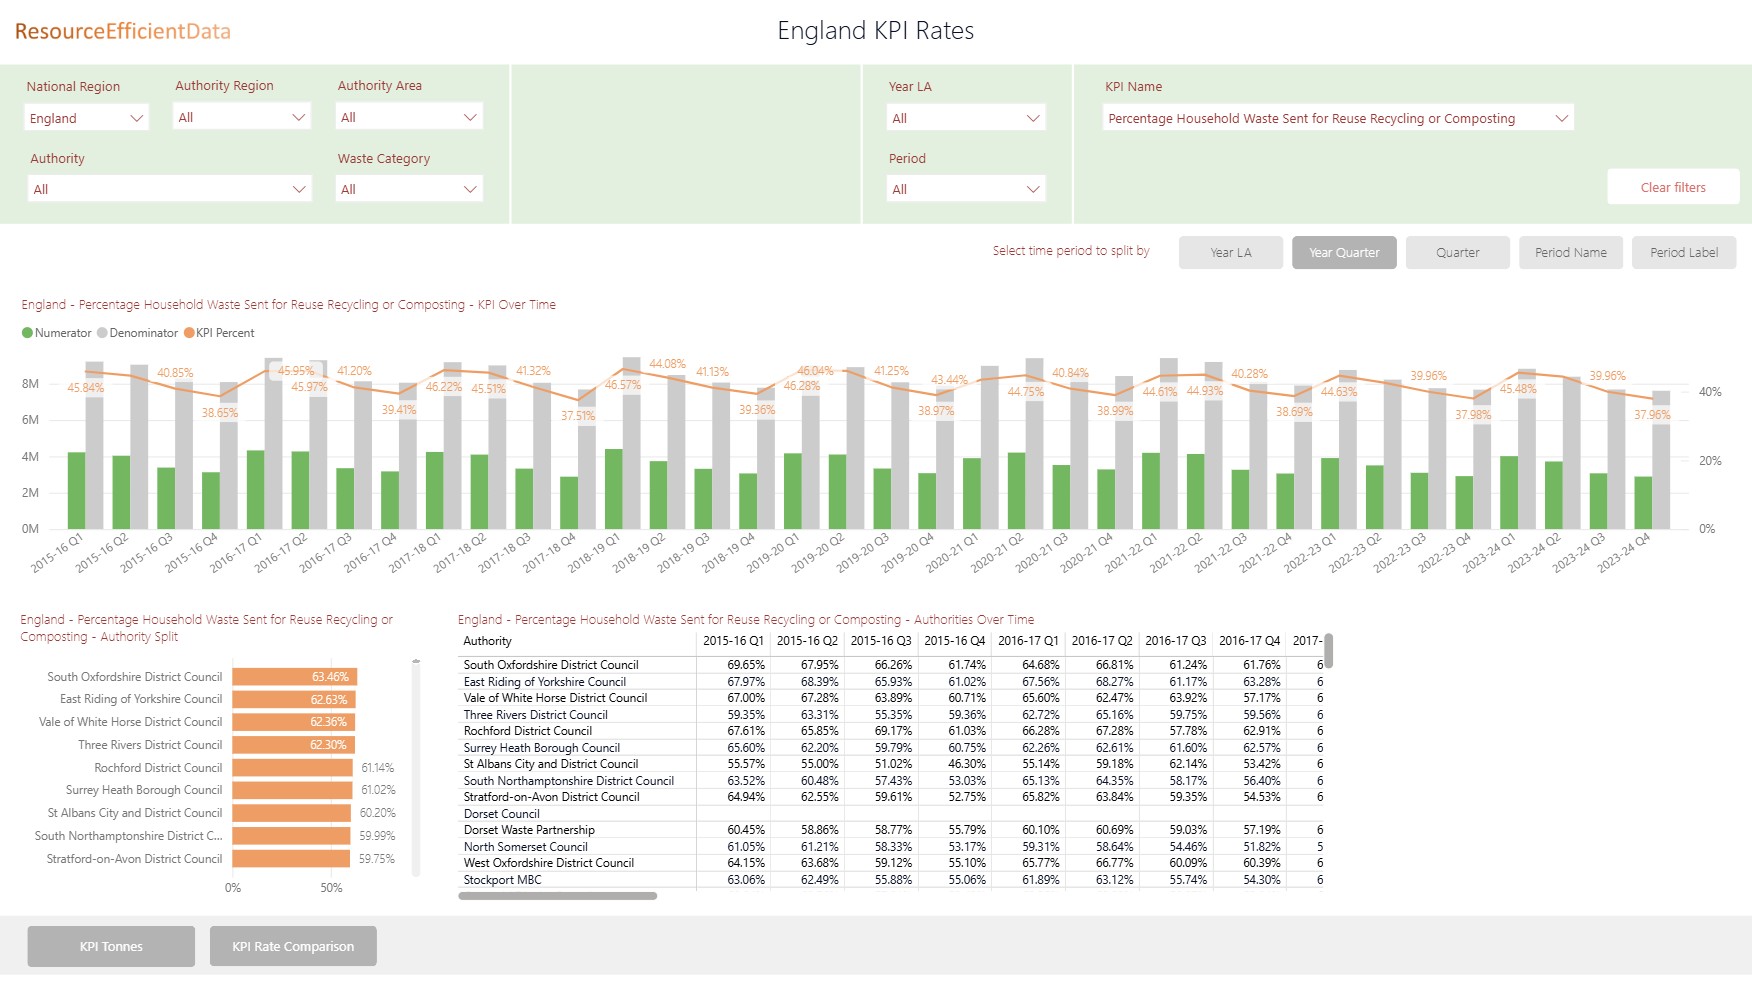
Recycling Rates and KPIs
Quarterly summaries of the main recycling KPIs from Waste Data Flow
- England, Northern Ireland and Wales
- Breakdown of recycling rates using the methodology from NI192 (England), KPI e2 (Northern Ireland), WMT 009b_10 (Wales)
- Currently ten years of data split by local authority, material and KPI category
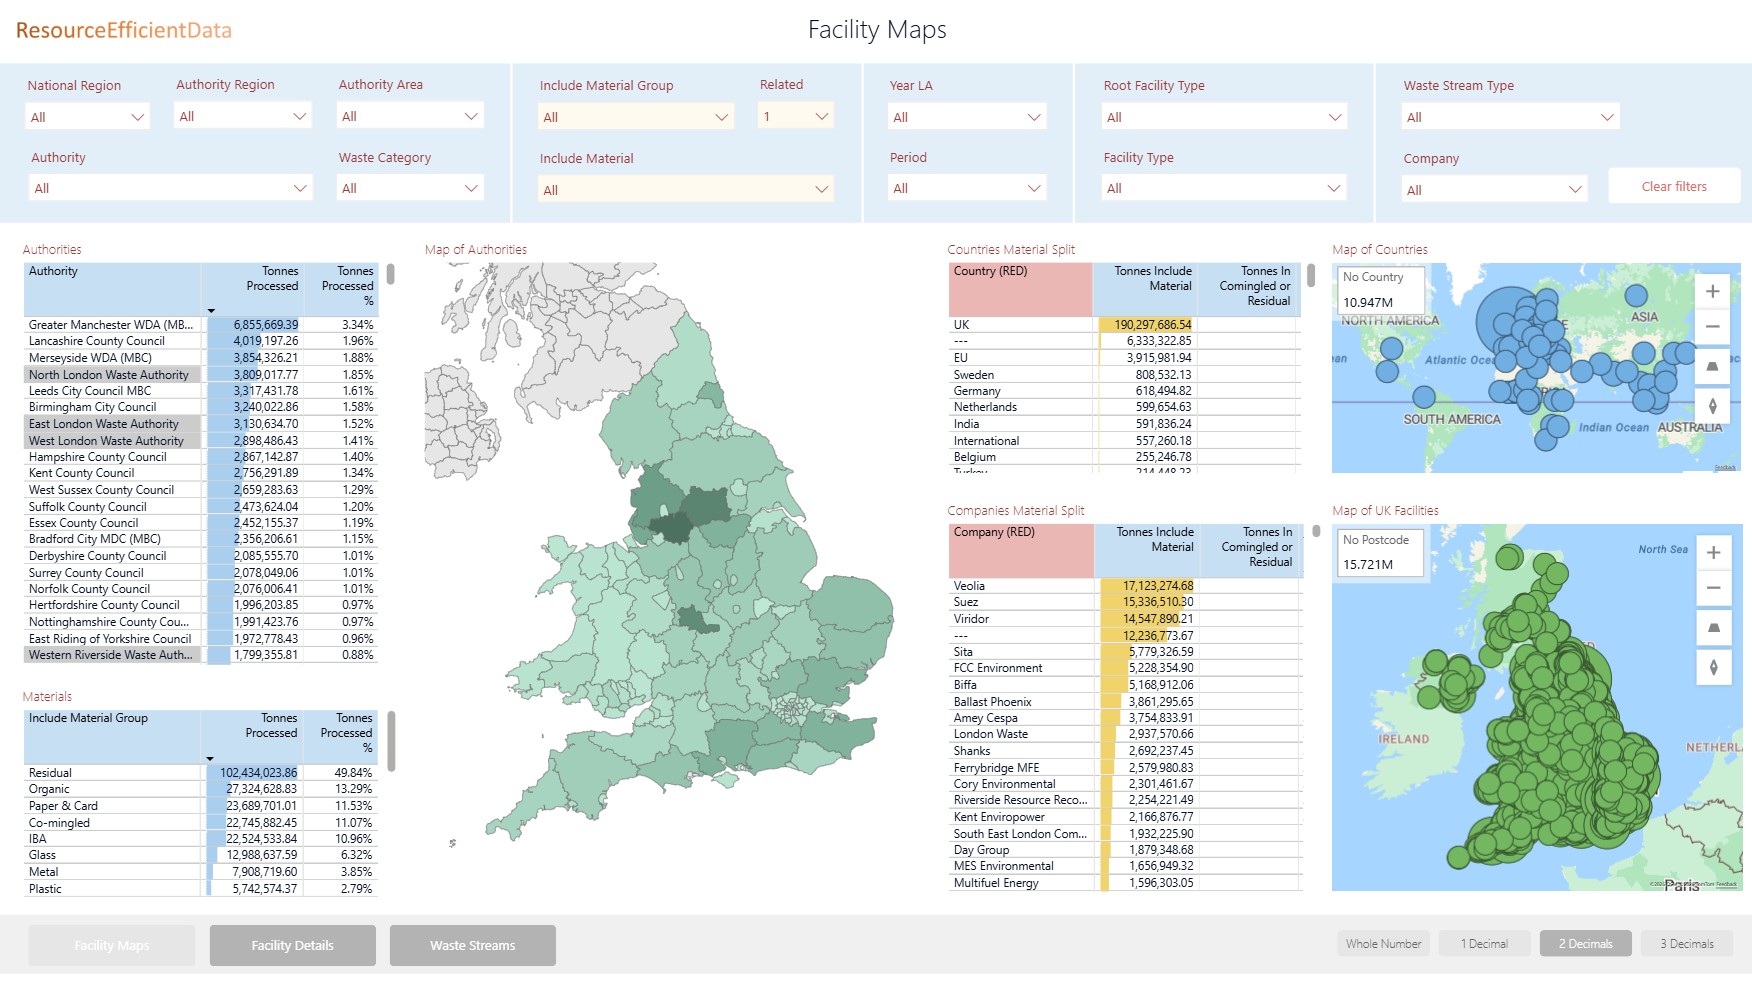
Waste Processing Facilities Reports
Summary of tonnages processed by facilities and companies (Q100) from Waste Data Flow
- England and Wales
- Six years of data split by local authority, material, facility type and facility/company
- Maps of tonnages by region and also facility location
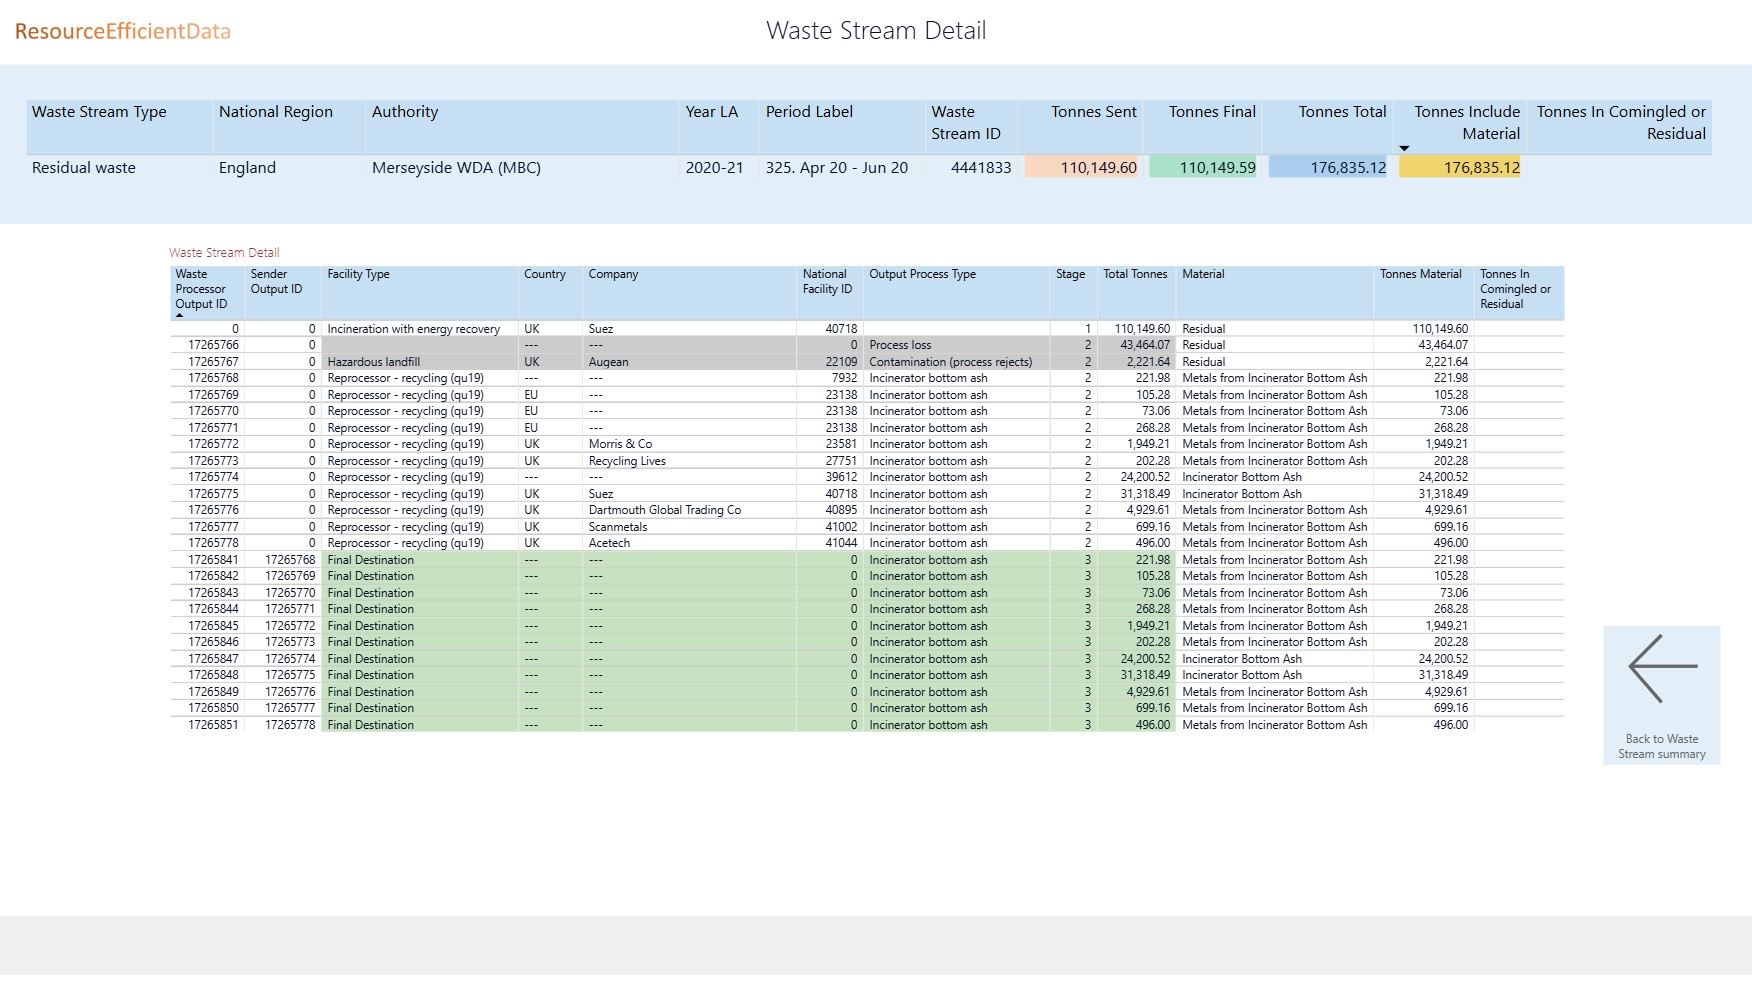
- Ability to drill-down to the detail - the tonnes of each material processed at every stage of every waste stream
- The facility locations and company names have been extracted from the Q100 dataset with a combination of automated and manual processing. For facilities without a dedicated NationalFacilityId, this means pulling out the postcodes and company names from text fields such as the FacilityAddress field. It involves substantial manual input from a waste management professional.
- Includes a page showing a summary of the raw data originally taken from Waste Data Flow, and how each facility entry in Q100 has been mapped and processed
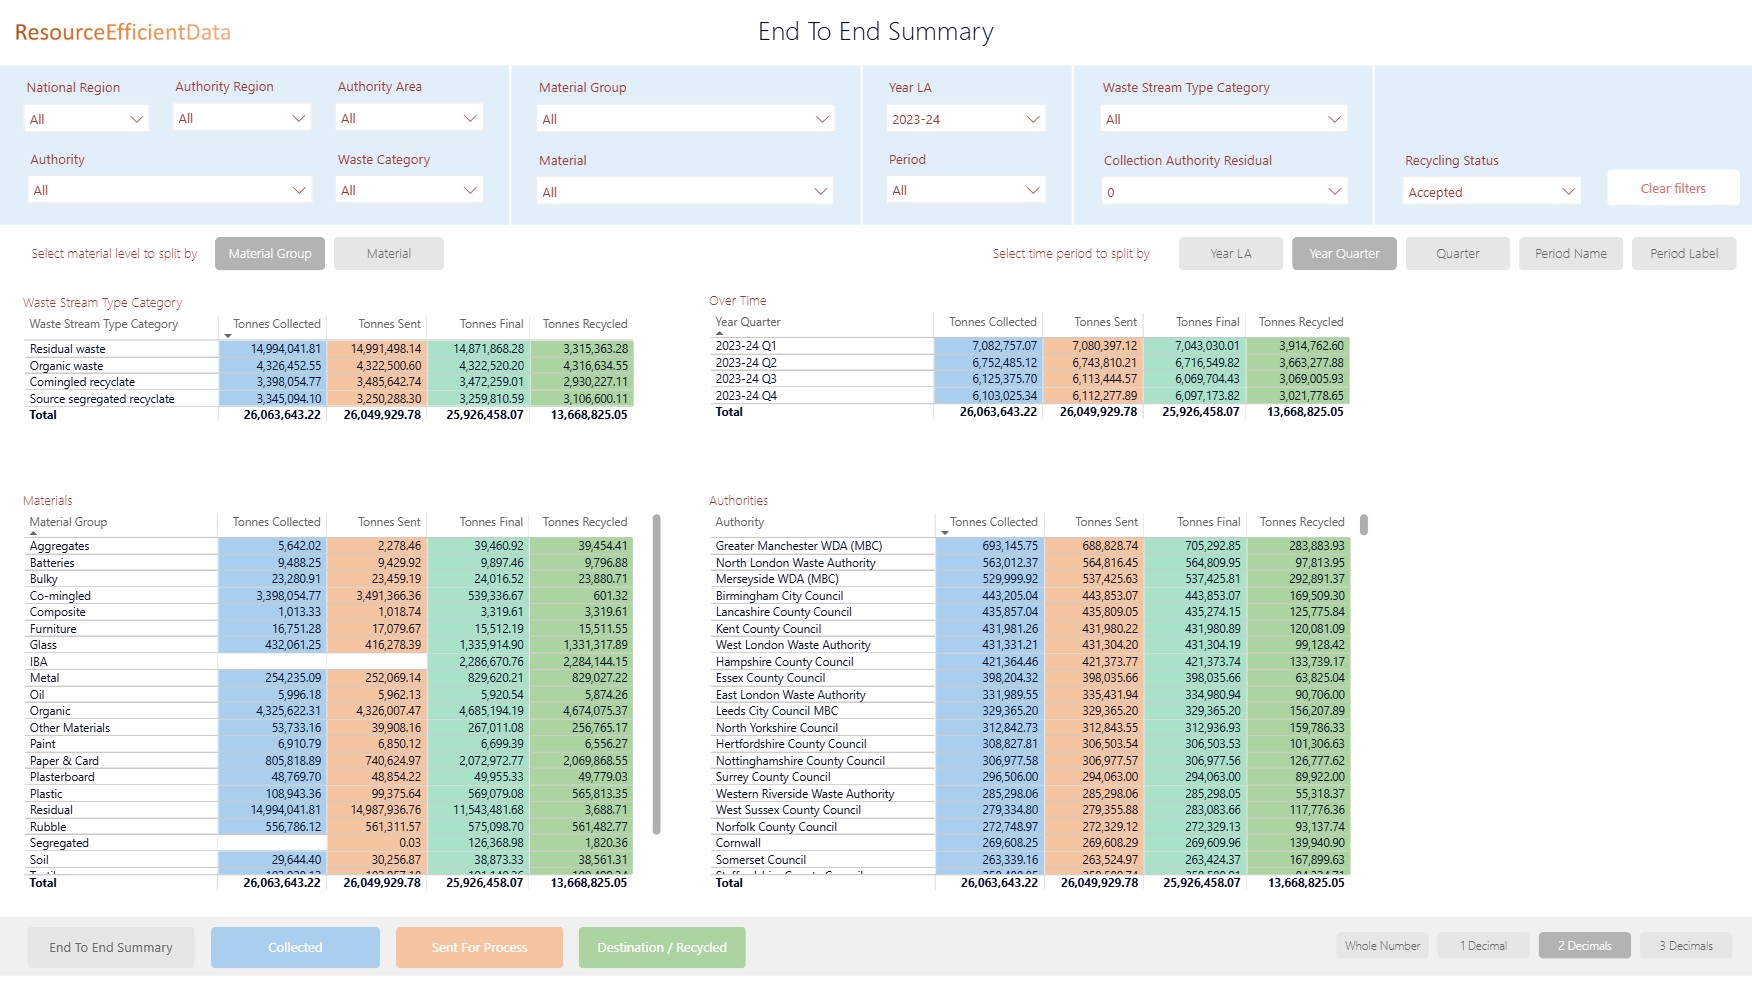
End to End Summary Reports
Summary of tonnages collected, sent for processing, reached destination and recycled from Waste Data Flow
- England, Wales and Scotland
- Ten years of data with an unprecedented overview of the full end-to-end processing of materials
- One dedicated page for each stage of the process, each with relevant details:
- Collected - Collection sources
- Sent for Process - Facility Types
- Destination - Final facility types and KPI categories